 OptimaTech Labs
Inside the Lab · Field note 009 · The Conflict Ledger
A Forecaster That Has to Show Its Work
Daily odds on five wars, built from sources you can open, judged against what happens, and set beside the betting markets.
Coverage of a war gives you opinions. Betting markets give you odds with no reasons attached. Almost nobody keeps score.
The Conflict Ledger is our attempt at all three: a number for what is likely to happen, the reporting behind that number, and a public record of whether it was right. It covers five conflicts: the US and Israeli war with Iran, Russia and Ukraine, Israel with Gaza and Lebanon, the Taiwan Strait, and the civil war in Sudan.
Checkable questions
Every forecast on the site answers a yes-or-no question with a deadline and written rules for what counts. “Will the US and Iran announce an agreement on reopening the Strait of Hormuz by 31 December 2026?” resolves YES only if both governments confirm it and a wire service reports it. A framework one side denies does not count.
Writing the rules first matters more than anything else on the site. A question that can be argued about after the fact can never be scored, and a forecast that can never be scored is just commentary.
Each conflict has a set of long questions that run to the end of the year or beyond, and a rolling set of short ones due in one to four weeks. Each week the model reads the latest reporting and drafts new short questions. Only drafts it rates between 20% and 80% are kept, because a near-certain question is not a fair test. An editor approves every question before it goes live.
Sources it can link to
Every morning the model searches wire services, regional outlets and each side’s own media for each conflict. It then reports which articles it found. We keep an article only if its exact link came back from the search itself. A link the model writes from memory, or gets slightly wrong, is dropped.
That one rule does a lot of work. Every source on the site opens to a real page, every claim in the ledger points to the article that reported it, and every resolution cites the report that settled it. Encyclopedias and other reference sites are excluded, so evidence is always reporting.
Forecasts, and the reasons for them
A second pass reads the recent articles, the history of each question and, where one exists, the price of a matching Polymarket market. It gives every open question a probability and says in plain words what moved it and which articles it relied on. When the evidence for a question is thin, it says so and stays close to the base rate.
Markets are an input, not an answer. On launch day the ledger put a general Russia-Ukraine ceasefire by 31 March 2027 at 8%, against 31.5% on Polymarket, because the Kremlin had again rejected ceasefire offers and the latest energy truce collapsed within days. The home page lists the biggest of these disagreements, and the scorecard will show who was closer.
Scored in public
When a question’s YES condition is reported, it resolves early with a link to the report. When a deadline passes, the model searches for what happened and the question resolves YES or NO only with a source; if the evidence is unclear, it stays open and an editor decides.
Every resolved question is scored with the Brier score: the squared gap between the forecast and the outcome, averaged over every day the question was open. Always saying 50% scores 0.250, and lower is better. Where a market priced the same question, its score sits beside ours. A calibration chart shows whether things we called 30% happened about 30% of the time. The first short-term deadlines fall between 7 and 14 November, and the results will be published whichever way they go.
Who said what, and were they right
Officials make predictions all the time: a strait will reopen within weeks, a city will fall by summer, talks will resume. The ledger records the ones a date can settle, with the speaker, their words, the source and a check date. After that date, a separate fact-checking pass judges the claim against the record and links its evidence.
The rules are the same for every side. Only named people and named bodies are recorded; anonymous sourcing is never scored. If the evidence is not clear, the claim is marked unclear, not false, and rechecked for a month. At launch the ledger held 80 claims from leaders and governments in Washington, Moscow, Kyiv, Tehran, Jerusalem, Beirut, Beijing, Taipei and Khartoum, 41 of them already judged true or false.
How wars move markets
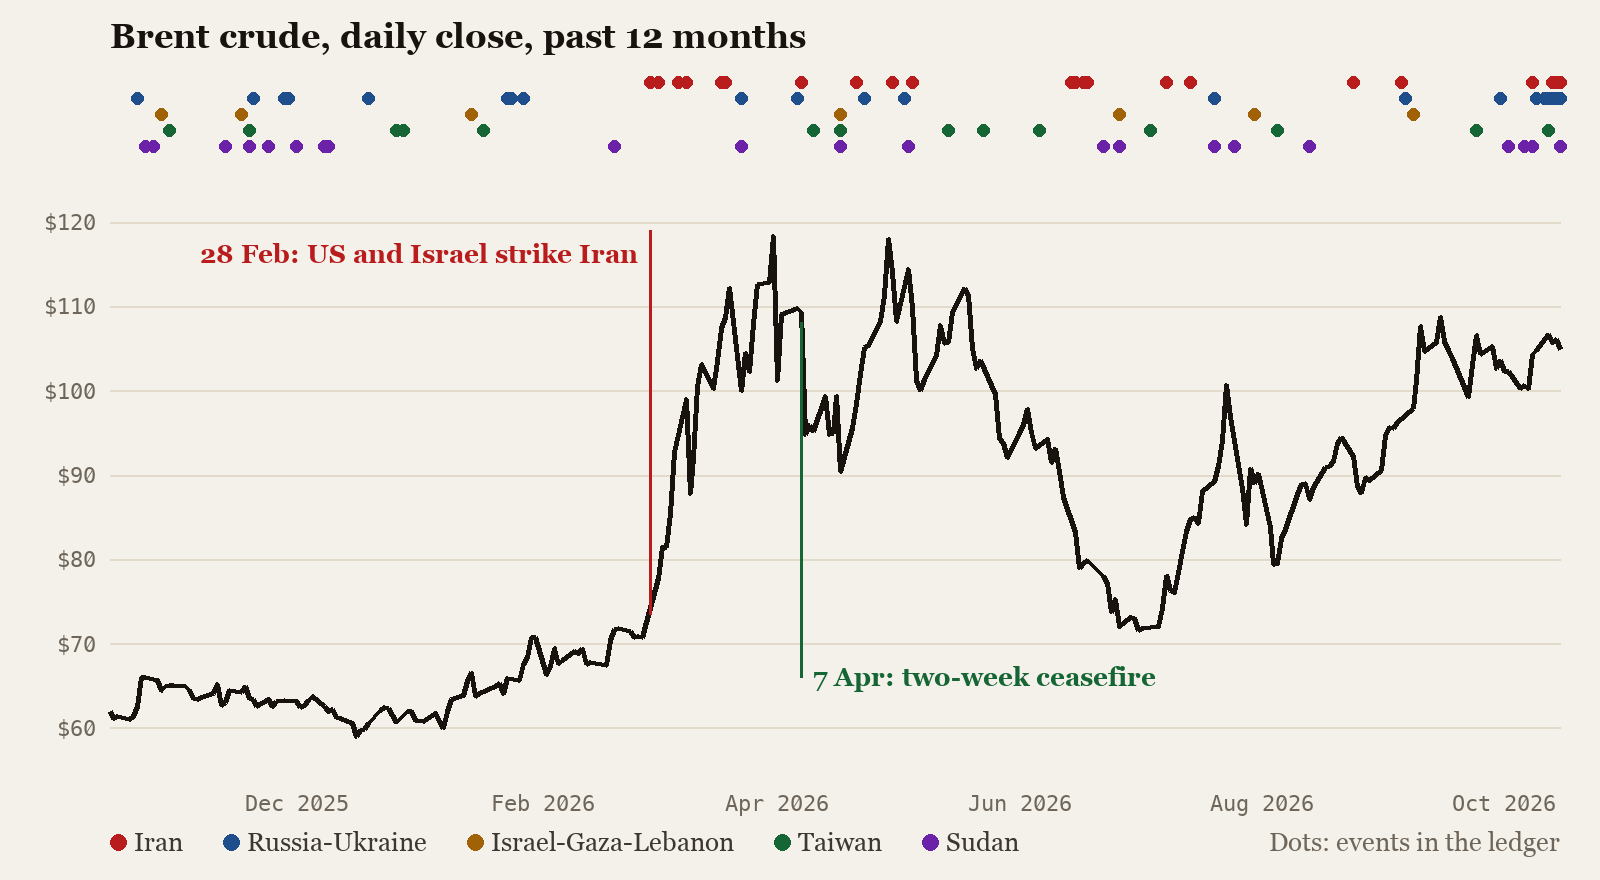
Prices for Brent, WTI, gold, the S&P 500, the VIX and a few others are collected every 15 minutes. Discrete events from the reporting, such as a tanker attack, a blockade, sanctions or a ceasefire, are stored with their time and matched against Brent before and a day after.
The past year shows why. Brent closed at $72.48 on 27 February, the day before the US and Israeli strikes on Iran, and reached $118.35 on 31 March. It fell from $109.27 to $94.75 the day after the 7 April ceasefire. A move after an event is not proof the event caused it, so the site shows the timing and leaves the conclusion to the reader.
Each day the model also gives the chance that Brent, gold, the S&P 500 and the VIX will be higher in exactly seven days. Those calls are scored automatically a week later, from the same price feed. It is a scoring exercise, not advice.
Moving the dials yourself
With each forecast the model also estimates how every question would move if one reading, such as escalation risk or diplomacy, went to its extremes, and under three or four switch scenarios like a ceasefire or a major strike. The war room on each conflict page combines those estimates so you can drag a reading or switch on a scenario and watch every forecast respond at once. The What if box goes further: describe a development in your own words and the model estimates how each question would move. Neither changes the ledger.
What we learned, and what’s next
The hard part was never producing a number. It was making every number traceable: to a question that can be settled, to sources that can be opened, and to a score that cannot be quietly forgotten. Each of those is a plain rule enforced in code, not a promise in a prompt.
Next come the first resolutions in November, a growing track record against the markets, and more conflicts once the method has proved itself on these five.
See it. Open the Conflict Ledger: every question, source and verdict is public. The morning brief is free by email. Or talk to us about forecasting, evidence pipelines and models that have to show their work.